

Sparta Rotterdam odds
 NetherlandsFounded 1888
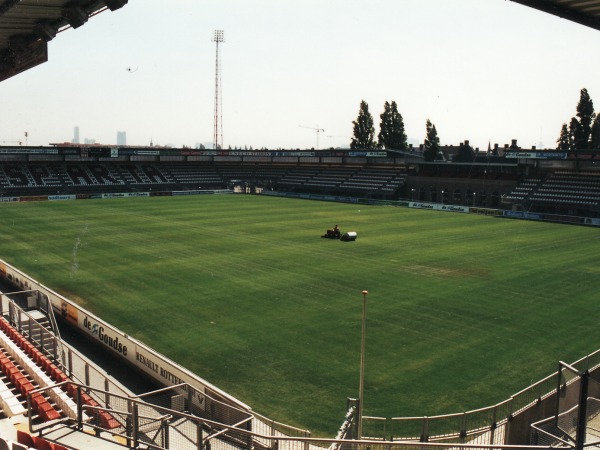
Season Report & Analysis
Sparta Rotterdam - League 2025/2026
Comprehensive statistical analysis of Sparta Rotterdam's season performance, including team metrics, player statistics, form analysis, home/away performance, and detailed insights.
Sparta Rotterdam is currently competing in the League 2025/2026 season, sitting in 10th position with 43 points from 30 matches. The team represents Netherlands in this competition.
The team's record of 12 wins from 30 matches represents a 35.3% win rate, showing mixed results throughout the campaign. With 40 goals scored and 62 goals conceded, the team achieved a -22 goal difference, indicating areas for improvement in both attack and defense. The team averaged 1.33 goals per game, demonstrating modest attacking output.
This comprehensive report provides detailed analysis of Sparta Rotterdam's season so far, including player performance metrics, form analysis, home and away performance, disciplinary records, and competitive insights. The data reflects the team's performance through 30 matches, showcasing their strengths, areas for development, and overall contribution to the competition.
Sparta Rotterdam sits in position #10 with 43 points from 30 matches played this season.
Sparta Rotterdam is currently competing in the 2025/2026 season, sitting in position #10 with 43 points from 30 matches, achieving a record of 12 wins, 7 draws, and 15 losses. The team averages 1.33 goals per game with a 35.3% win rate.
Sparta Rotterdam has a goal difference of -22, having scored 40 goals and conceded 62 goals.Tobias Lauritsen tops the scoring charts with 9 goals. Patrick van Aanholt leads in assists with 3, highlighting the creative talent throughout the team.
Home and away performance analysis shows that Sparta Rotterdam has earned 23 home pointscompared to 20 away points. The team demonstrates a slight home advantage with a 0.2% difference.
Goal distribution analysis shows that matches with 2-3 goals represent the most common outcome, accounting for 36.7% of all matches. The highest-scoring match was PSV vs Sparta Rotterdam, ending 6-1 with 7 total goals. The biggest victory margin came when Sparta Rotterdam defeated Go Ahead Eagles 3-0 with a 3-goal margin. These statistics highlight the competitive nature and entertainment value of Sparta Rotterdam's season.
This comprehensive analysis covers Sparta Rotterdam's performance in the 2025/2026 season in Netherlands, providing detailed statistics and insights into the team's performance, player contributions, and competitive standing.
The top scorer leads the scoring charts with 9 goals. View goals, assists, and ratings for Sparta Rotterdam's squad.
Goals per 90




Shots per 90



Tackles per 90



Key Passes

Clean Sheets

Saves per 90
Summary
Tobias Lauritsen leads Sparta Rotterdam's scoring charts with 9 goals, demonstrating exceptional finishing ability and consistency throughout the season. Patrick van Aanholt has provided the most assists with 3, highlighting the creative talent in the team. The squad features a diverse range of attacking players, with the top 9 scorers contributing significantly to the team's success.
These players represent the elite talent in Sparta Rotterdam, showcasing world-class skills across scoring, creativity, defensive work, and goalkeeping. The per-90 statistics provide fair comparisons across players with varying playing time, highlighting those who make the most impact when on the pitch.
Sparta Rotterdam has earned 23 points at home and 20 points away. Performance is balanced across venues.
Home Advantage
Moderate home advantage
Points per Game
Home vs Away Points
Performance Summary
Sparta Rotterdam's home advantage is 0.18 points per game, suggesting balanced performance regardless of venue. The team averages 1.35 points at home compared to 1.18 points away.
Sparta Rotterdam has accumulated 23 points at home from 17 matches (6W 5D 6L) and 20 points away from 17 matches (6W 2D 9L). This balanced record demonstrates their ability to perform consistently regardless of venue, showing adaptability and mental strength in different environments.
Sparta Rotterdam shows remarkable consistency across venues, with the most balanced home-away record - 23 home points and 20 away points - demonstrating their ability to perform consistently regardless of venue. This balanced approach indicates strong mental resilience and tactical adaptability.
Matches average 1.3 goals per game. The most common outcome is 2-3 total goals.
Average Goals per Match
Across 30 matches
Team Goals per Game
Goals scored per match
Goals per Match Distribution
Distribution by Percentage
Summary
Across 30 completed matches for Sparta Rotterdam, the team's matches average 3.10 goals per match. The most frequent outcome is 2-3 goals, representing 11 matches (36.7% of all fixtures), indicating a balanced approach where both attacking play and defensive organization are rewarded.
Low-scoring encounters (0-1 goals) make up 23.3% of matches (7 matches), highlighting the importance of defensive discipline and tactical awareness. Meanwhile, high-scoring thrillers (4+ goals) have occurred 12 times (40.0% of all matches), demonstrating the attacking quality and entertainment value present throughout the season.
The team's tactical sophistication is evident in its 1.33 goals per game average, reflecting a focus on defensive organization and strategic play. This distribution indicates that the team prioritizes defensive stability, making every goal valuable and matches often decided by fine margins and tactical execution.
Sparta Rotterdam scores 1.33 goals per game while conceding 2.07. Overall points efficiency: 1.43 points per match.
Attack Efficiency
Goals per game
Defense Efficiency
Goals conceded per game
Points Efficiency
Points per game
Efficiency Analysis
Team efficiency metrics reveal how effectively Sparta Rotterdam converts opportunities into results. The team leads in attack efficiency with 1.33 goals per game, while demonstrating defensive efficiency, conceding just 2.07 goals per game.
The most efficient teams combine strong attacking output with defensive discipline.Sparta Rotterdam leads in points efficiency with 1.43 points per game, demonstrating the optimal balance between scoring goals and preventing them. Teams that maintain high efficiency rates throughout the season consistently challenge for top positions and maximize their potential.
Efficiency metrics provide deeper insights than simple win-loss records, revealing which teams are getting the most out of their opportunities. Sparta Rotterdam's goal difference of -22 reflects that the team concedes more goals than they score on average, suggesting defensive improvements are needed.
Sparta Rotterdam has received 24 cards this season (21 yellow, 2 red) from 99 fouls.
Yellow Cards
Red Cards
Total Cards
Total Fouls
Cards per Foul
Cards Distribution
Penalty Conversion
No penalty data available
Penalty statistics will appear here once data is collected
Disciplinary Events Overview
Disciplinary Analysis
Sparta Rotterdam has demonstrated a relatively disciplined style of play throughout the season. The team has seen 24 total cards issued across 30 matches, with 21 yellow cards and 2 red cards. This translates to an average of 0.80 cards per match, demonstrating relatively disciplined conduct throughout the season.
Yellow card distribution shows that 87.5% of all disciplinary actions were cautions, averaging 0.70 yellow cards per match. Red cards accounted for 8.3% of total disciplinary actions, with an average of 0.07 red cards per match. The team recorded 99 total fouls, averaging 3.30 fouls per match, which provides context for the disciplinary patterns observed.
Overall, the disciplinary record of Sparta Rotterdam reflects a disciplined approach to match conduct. The balance between competitive intensity and disciplinary control shapes the tactical landscape, influencing how the team approaches matches and manages player behavior throughout the season.
Upcoming fixtures with compelling storylines based on Sparta Rotterdam's current position (#10), recent form, and what's at stake.
No upcoming fixtures with compelling storylines at this time.
Winter 2027 window: 2 incoming, 2 outgoing. Net seller this window.
Sparta Rotterdam is a [Net seller] in the [Winter 2027 window]. Spent €500,000 and recouped €5,000,000, for a net of €4,500,000. Incoming moves: 2, outgoing moves: 2.
| Player | Fee | From | To | Date |
|---|---|---|---|---|
| €500,000 | Aug 18, 2025 | |||
| — | Aug 15, 2025 |
 FC TwenteSparta Rotterdam
 BurnleySparta Rotterdam
Compare Sparta Rotterdam's transfer activity against other teams in the league during the Winter 2027 window.
| Team | Inbound | Outbound | Spent | Recouped | Net |
|---|---|---|---|---|---|
| 2 | 2 | €500,000 | €5,000,000 | +€4,500,000 |
 | 4 | 2 | €24,300,000 | €0 | -€24,300,000 |
 | 4 | 9 | €0 | €0 | €0 |
 | 6 | 4 | €2,150,000 | €6,800,000 | +€4,650,000 |
| 3 | 4 | €5,700,000 | €2,500,000 | -€3,200,000 |
 | 10 | 5 | €22,000,000 | €22,900,000 | +€900,000 |
 | 1 | 0 | €0 | €0 | €0 |
 | 3 | 5 | €16,300,000 | €10,000,000 | -€6,300,000 |
 | 2 | 2 | €800,000 | €300,000 | -€500,000 |
 | 5 | 1 | €0 | €0 | €0 |
 | 2 | 3 | €100,000 | €0 | -€100,000 |
 | 3 | 1 | €0 | €0 | €0 |
 | 5 | 4 | €0 | €0 | €0 |
 | 4 | 0 | €0 | €0 | €0 |
 | 3 | 2 | €0 | €0 | €0 |
 | 3 | 3 | €0 | €0 | €0 |
 | 3 | 3 | €0 | €0 | €0 |
 | 2 | 4 | €0 | €0 | €0 |
Biggest Fees (League Teams)
 Ajax →
 Sunderland
 FC Bayern München →PSV
 Borussia Mönchengladbach →Ajax
 Anderlecht →Ajax
 AZ →
AZ → Bayer 04 Leverkusen
 Parma →PSV
Summary
The most aggressive spender is PSV (€24,300,000 outlay), while Ajax leads receipts at €22,900,000. Net leaders are topped by NEC Nijmegen (+€4,650,000), with the largest deficit at PSV (-€24,300,000). Activity bars flag recruitment volume; money-flow bars reveal gross spend plus recouped fees, surfacing the most liquid clubs. Biggest-fee deals spotlight premium valuations (Brian Brobbey for €20,000,000), guiding scouts to headline movers and hinting where quieter value may remain.
See how Sparta Rotterdam's top performers compare against the league's best in goals, assists, and overall ratings.
Top Goal Scorers in Competition










Top Assists in Competition









Top Rated Players in Competition





Summary
This ranking compares Sparta Rotterdam's top performers with the best players across the entire competition, showing how the team's elite talent stacks up against other teams' top players. The rankings are sorted by total goals, assists, and average rating, providing a clear view of where Sparta Rotterdam's players rank within the competition.
In the goal-scoring category, Sparta Rotterdam's top scorer Tobias Lauritsen ranks 5th in the competition with 9 goals, showing strong scoring output compared to other top players.
For assists, Sparta Rotterdam's top playmaker Patrick van Aanholt ranks 11th out of the top 11 players with 3 assists, providing valuable creativity to Sparta Rotterdam's attack.
In player ratings, Sparta Rotterdam's highest-rated player Tobias Lauritsen ranks 9th in the competition with a 7.4 rating, showing strong individual performances.
Common questions about Sparta Rotterdam's performance, statistics, and season outlook answered.
What is Sparta Rotterdam's current position?
Sparta Rotterdam is currently in position #10 with 43 points from 30 matches.
Who is Sparta Rotterdam's top scorer?
Tobias Lauritsen leads Sparta Rotterdam with 9 goals this season.
How has Sparta Rotterdam performed at home vs away?
Sparta Rotterdam has earned 23 points at home and 20 points away. The team performs better at home.
What is Sparta Rotterdam's goal difference?
Sparta Rotterdam has a goal difference of -22, having scored 40 goals and conceded 62 goals.
How many clean sheets has Sparta Rotterdam kept?
Sparta Rotterdam has kept 10 clean sheets this season, averaging 0.33 clean sheets per game.
What is Sparta Rotterdam's win rate?
Sparta Rotterdam has a win rate of 35.3%, with 12 wins, 7 draws, and 15 losses.